
 Be om info/pris
- © 2026 Norsonic
- Sekretesspolicy
- Laget av NYG


Ett moduluppbyggt koncept för akustisk kamera!
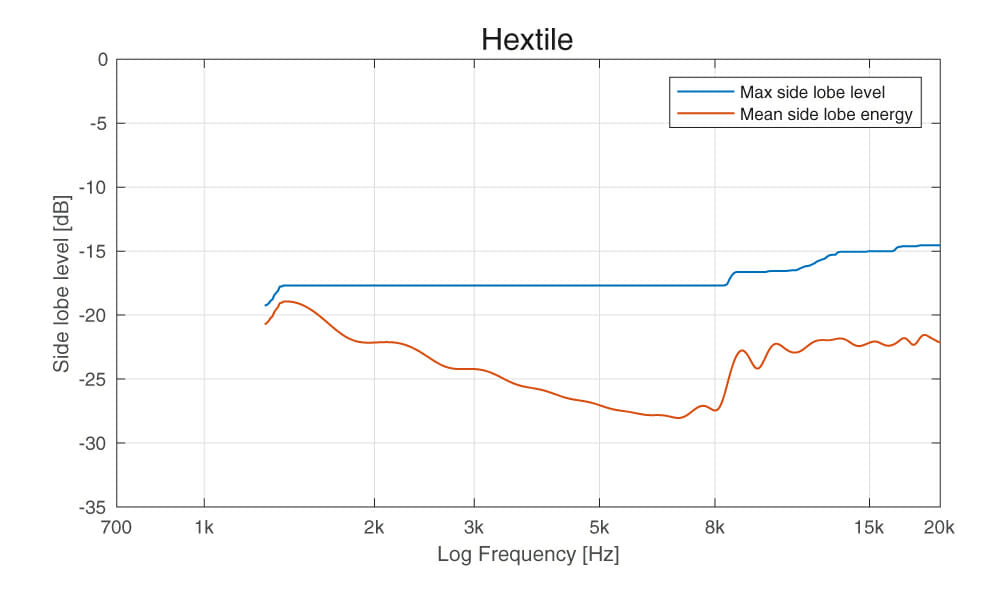
Hextile – Låg vikt och portabel
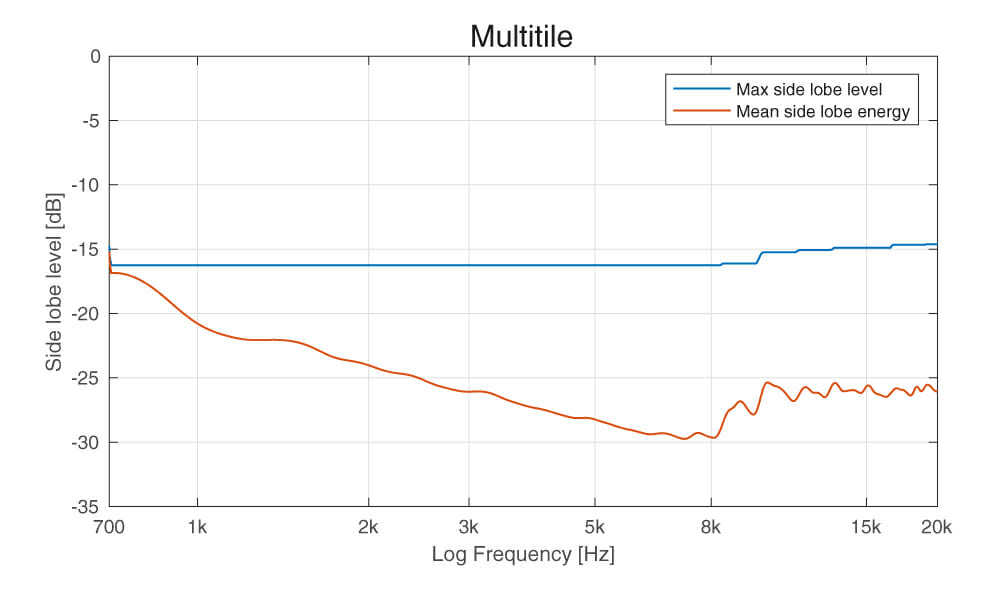
Multitile – Bra upplösning
Multitile (LF mode) – Låga frekvenser
Här är resultatet av våra kunders önskemål!
En portabel akustisk kamera med låg vikt, bra upplösning och förmågan att även kunna mäta och analysera låga frekvenser.
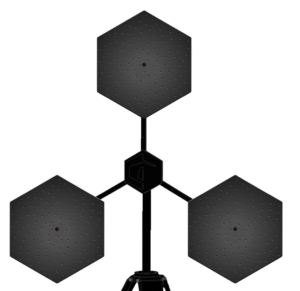
128 mikrofoner – 46cm.
Med en Hextile har användaren en fältmässig akustisk kamera med låg vikt som kan användas för ett brett spektrum av mätuppdrag. Systemet kan monteras på tripod eller användas handhållet.
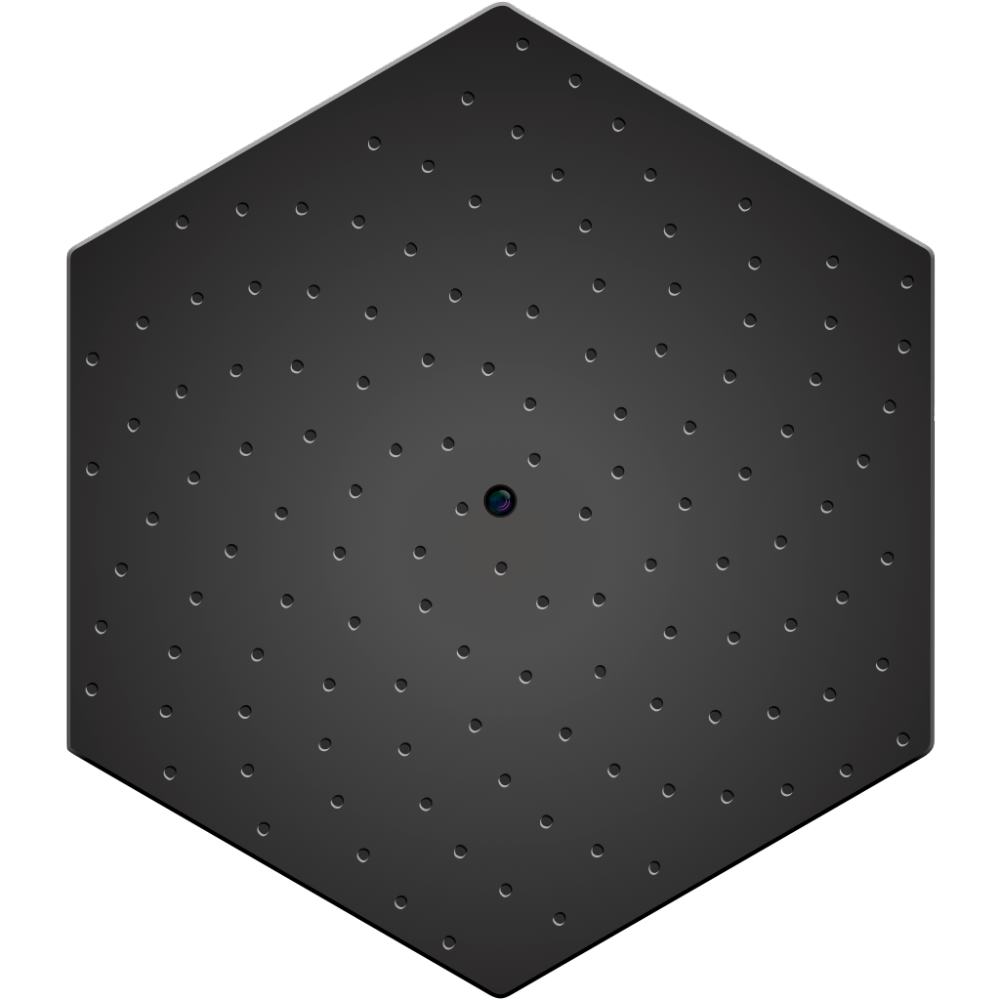
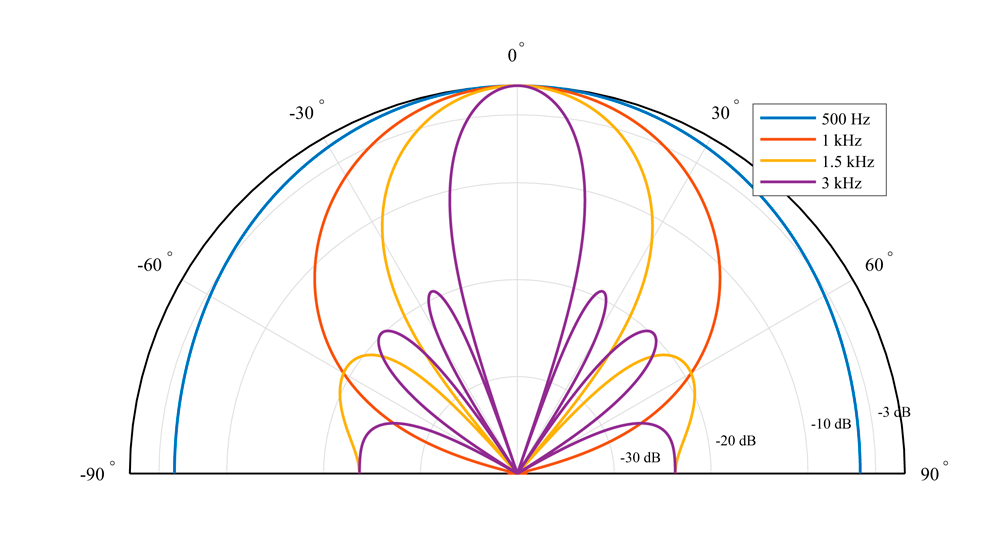
Array geometry and beampattern for Hextile
384 mikrofoner – 96cm.
För användare som önskar optimal upplösning för att kunna analysera flera ljudkällor parallellt i ett brett frekvensområde, kan tre Hextiles enkelt kombineras till en kraftfull Multitile Akustisk kamera.
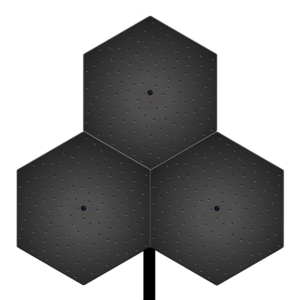
Multitile – great resolution
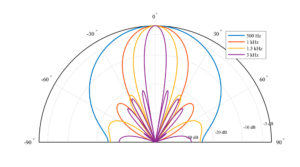
Array geometry and beampattern for Multitile
384 mikrofoner – 146cm.
Genom att placera tre Hextiles på större avstånd, ökas den maximala diametern för det kompletta systemet, vilket gör det idealiskt för mätning på lågfrekventa ljudkällor – Genialiskt!
Multitile (LF mode) – Low frequency measurements
Array geometry and beampattern for Multitile (LF mode)
The software design strategy has always had user friendliness and ease of use in mind. We want the user to be able to get results quickly, and start analysing recordings easily, thus spending time on the analysis, rather than the measurement set up or configuration of parameters. Live view of measurements combined with an intuitive software interface enables users without prior experience to make measurements within the first five minutes after powering the device.
The one feature that really sets the software apart is the virtual microphone. The virtual microphone enables the capability to only get audio signals from the chosen listening point, and listen to sounds coming from specific directions of the video image, while suppressing noise and sounds emitting from other positions than what is selected. With this tool the user has the power of super hearing, and may gain more insight in addition to regular colour plotting of sources. Such super hearing may be especially useful in noisy and complex sound environments, where for instance different noise sources greatly impair the ability to distinguish which machinery is producing a faulty noise.
In addition to live plotting and directive listening, it is also possible to record measurements and do the analysis at a later time. The raw signal from all microphones are then saved, and all parameters such as frequency selection, time selection and so on can be changed in post-processing. This means that a recording can be done without selecting the optimal parameters during the measurement, since these can be changed when analysing the recording. This also means that anybody can do the actual recordings themselves since it is then basically a matter of pointing the array roughly towards the area of interest and pressing record. All analysis and changes of parameters can be done in post-processing such as directive listening, graphical overlay of sources, spectrogram, FFT analysis and so on.
Sometimes sources may be closely spaced apart, or a strong noise source in the area of interest is interfering with the recording and impairing the image quality. Often this will be seen as either a single large source, or the source of interest will be completely shadowed by the stronger source. Seen in the image below is a situation where two equally strong sources are positioned close to one another, and the resulting colour plot will display a single large source. In such situations the acoustic eraser feature may prove valuable. This function will add a red circle to the screen that can be dragged to any point, and remove the source from that point. This is highly effective when several noise sources are present. As seen on the pictures the acoustic eraser completely removes the source where the suppress point button is positioned. The virtual microphone can further be positioned on the source of interest.
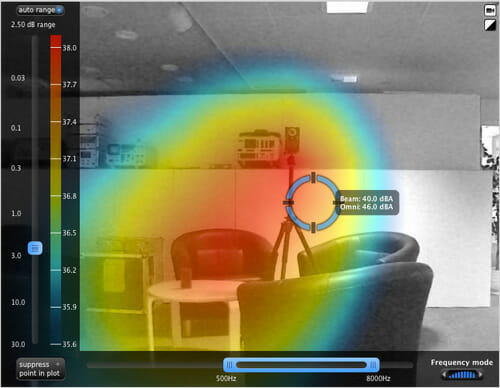
Acoustic camera acoustic eraser
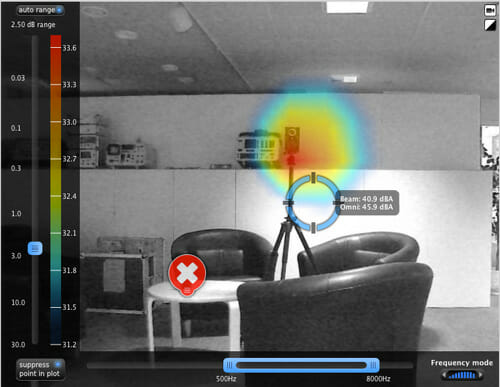
Acoustic camera acoustic eraser
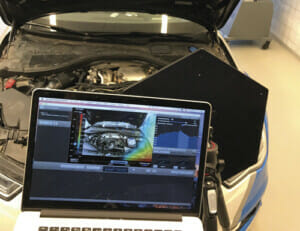 Especially in automotive applications RPM measurements may give vital information. The acoustic camera software has the possibility to display frequency content as a function of RPM by using the order analysis function.
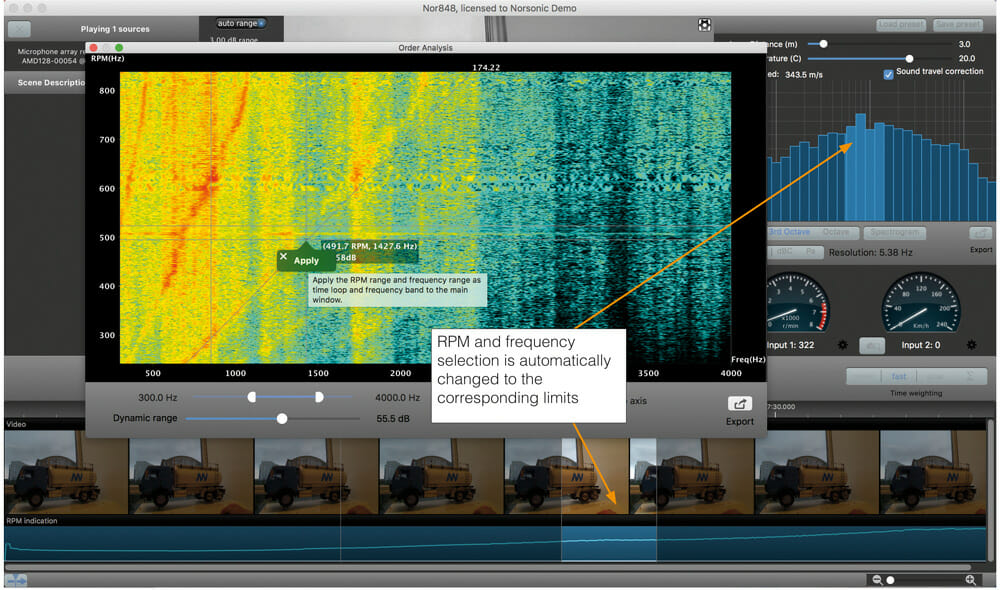
In the spectrogram window, frequency as a function of RPM is plotted. It is further possible to select a square in the spectrogram window to isolate interesting events. By pressing the “apply” button on the selection, the RPM and frequency limits in the main view window automatically change to the limits set by the selection in the spectrogram. The user may then find and interesting sound event in the spectrogram, and automatically get the corresponding colour plotting of the event chosen.
Acoustic camera rpm
Connection: USB
Microphones: 128 MEMS microphones
Max sound level: 120 dB
Min sound level (system): 9 dBA
SNR per microphone: 65 dBA
SNR array (system): 82 dBA
Audio sampling rate: 44.1 kHz
Camera resolution: 2592 x 1944
Opening angle: 105°
Frame rate: 15 FPS
Operating temperature range: -40 to +85
Per microphone (flat): 100 Hz – 20 kHz
Per microphone: -26 +/-3dBFS/Pa @1 kHz 94 dB
Spatial sensitivity Hextile: 410 Hz – 20 kHz
Spatial sensititivy Multitile: 220 Hz – 20 kHz
Spatial sensititivy Multitile (LF mode): 120 Hz – 1 kHz
Dimension Hextile: 41 cm x 48 cm, Ø 48 cm
Dimension Multitile: 83 cm x 84 cm, Ø 96 cm
Dimension Multitile (LF mode): 126 cm x 121 cm, Ø 146 cm
Weight Hextile: < 3 kg
Weight Multitile: < 10 kg
Material: Aluminium
Power consumption: < 3 W
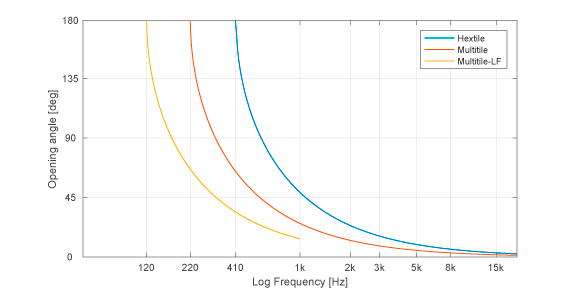
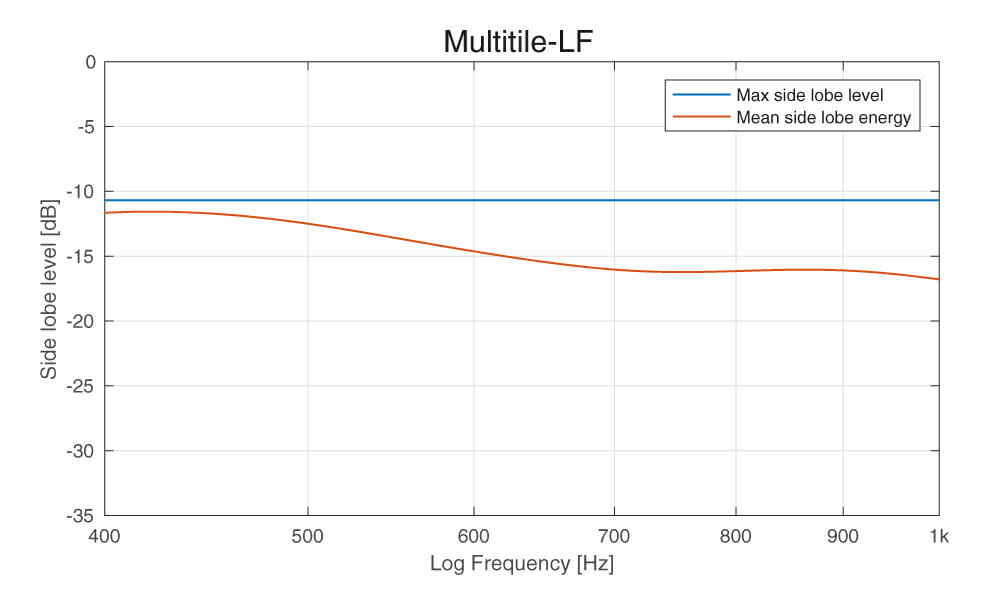
Multitile-LF
Multitile
Hextile
The biggest improvement when going from a single Hextile to the two different Multitile configurations is best demonstrated on a low frequency source. Seen below are the results from recordings on a single omnidirectional noise source emitting pink noise, with the colour plotting being done when the input signals are filtered at 500 Hz. This should give a direct comparison of the low frequency capability of the different arrays.
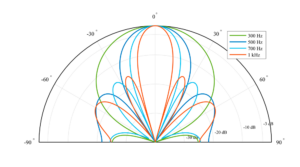
At the top are the different array configurations used for the recordings, with a 128 element Hextile, a 384 element Multitile, and a 384 element Multitile (LF mode). The diameters of the array configurations are 46 cm, 96 cm, and 1.46 m respectively.
The second rows show the beampattern for the different array configurations at 500 Hz and 3 dB dynamic range. As can be seen the beampattern gets more narrow, thus giving better resolution, as the overall array size increases.
Lastly the plotting results from the three different array configurations recorded on a real noise source are shown with 3 dB dynamic. The improvement in terms of resolution and pin-pointing the source is clearly visible when using bigger equipment.
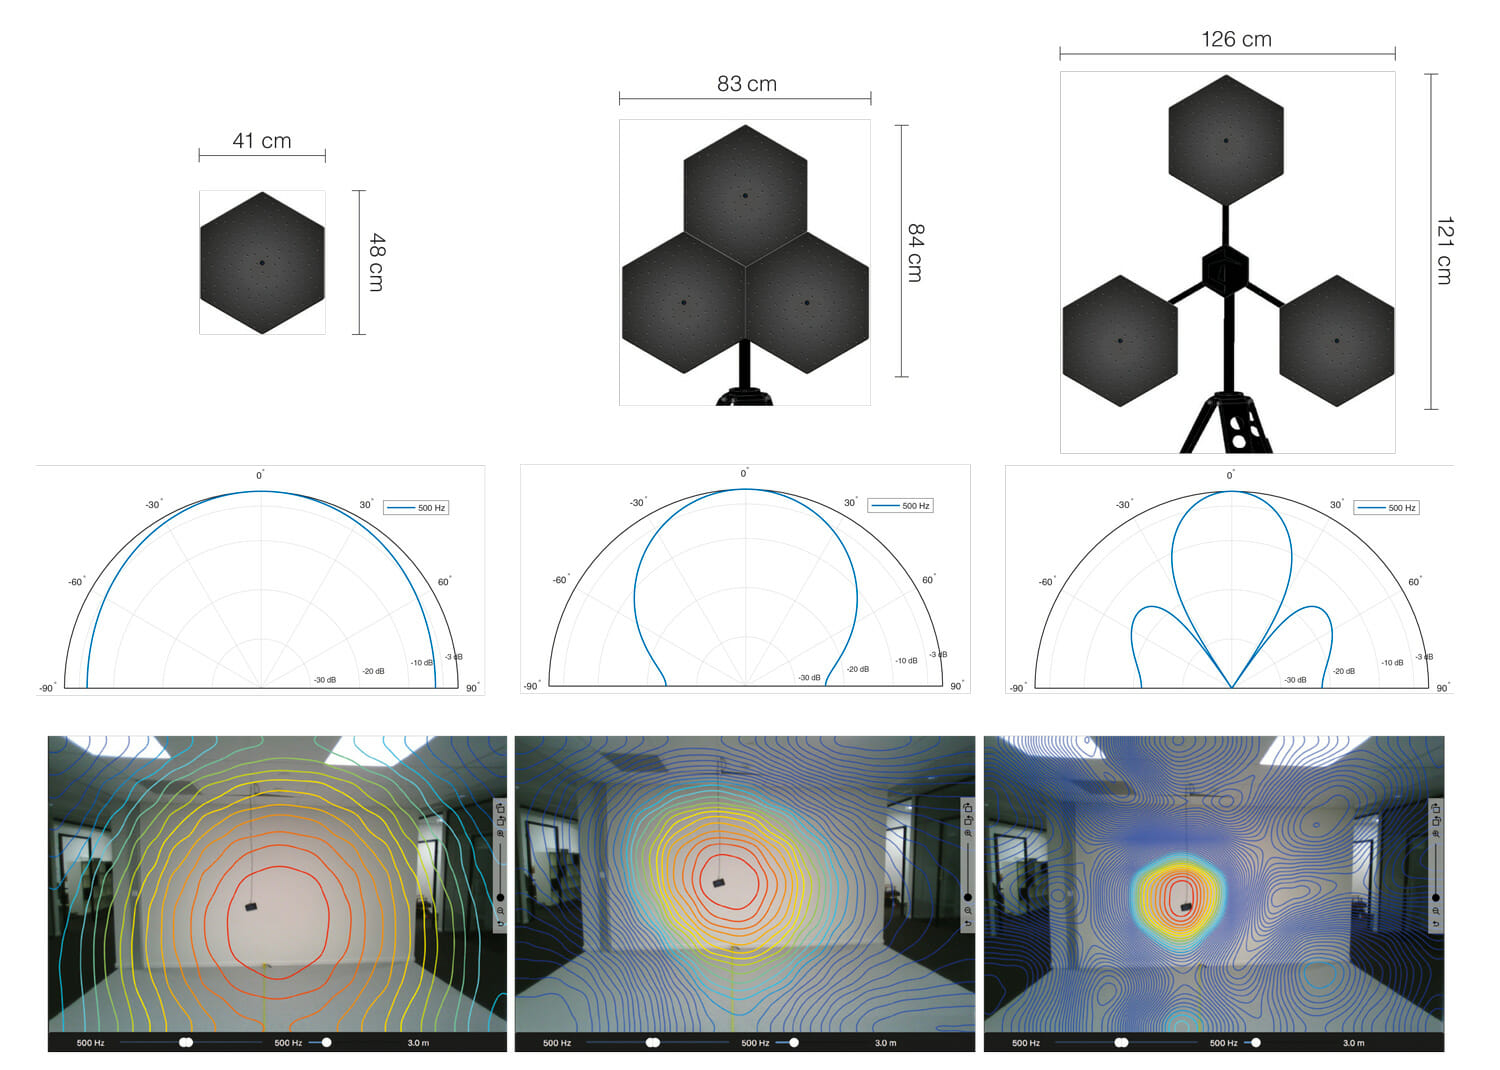
Array geometry, beampattern at 500 HZ, and plotting results of pink noise source for Hextile, Multitile and Multitile (LF mode)
Please note:
Requires macOS version 13.7 or newer
All users who already have an acoustic camera and are going to switch to version 5.0 MUST get a new license.
Norsonic Acoustic Camera
Filming sound leakages in highly reflective office environment
Measurements in office complex, Lier, Norway, April 2016
Norsonic Acoustic Camera
Filming breakout noise from café and concert venue
Measurements in bar and bistro in Oslo, Norway, March 2016
Norsonic Acoustic Camera
Measuring impact of traffic noise in apartment living room
Measurements in apartment Oslo, Norway, February 2016
Norsonic Acoustic Camera
Wall leakage testing in the lab with acoustic camera
Measurements in acoustic lab, England, November 2015
Norsonic Acoustic Camera
Using acoustic camera inside caravan car to find squeak and rattle noise
Measurements in caravan car, Lier, Norway, October 2015
Norsonic Acoustic Camera
Filming low-frequency structure born noise with acoustic camera
Measurements in apartment building, Oslo, Norway, September 2015
Norsonic Acoustic Camera
Identifying short time high pitch squeak noise from electric window in car door
Measurements in car factory, Korea, July 2015
Norsonic Acoustic Camera
Pinpointing low level sanitary noise in apartment building
Measurements in apartment building in Oslo, Norway, April 2015
Norsonic Acoustic Camera
Finding acoustical weak points in room dividing modular walls
Measurements in a conference hotel in Trondheim, Norway, November 2014
Norsonic Acoustic Camera
Identifying low-frequency tonal noise in windy and noisy conditions
Measurements on LNG gas terminal in Stavanger, Norway, September 2014

